Reporting behaviour associated with safety-related accidents, incidents, and hazards is a concern for many managers, regulators, safety specialists, operational staff and others such as patients and passengers. The concerns differ depending on the role and the situation. People may be concerned about underreporting, excessive reporting, the consequences of reporting, or even the point of reporting. Over the years, I’ve tried to understand this along with colleagues via a number of methods, including questionnaires and group interviews in many organisations. What is clear is that there are many influences on reporting behaviour, and these influences are interrelated. While we may seek one simple explanation for reporting behaviour, the reality is that several issues interact.
A useful way to understand such influences is via influence diagrams. Influence diagrams represent how components or elements of a situation influence each other and the situation under consideration, from a particular perspective. They are depicted as ellipses or ‘blobs’ and arrows indicating influence of each component on another. They do not represent causation and do not show sequence of events or activities. They are a helpful means of having a conversation via the gradual building of the diagram, or otherwise representing and understanding data from research and practice.
It can be difficult to know where to start an influence diagram. For influence diagrams that deal with human behaviour, models of basic known influences on behaviour are a good starting point. One such model is the COM-B model (Michie, et al, 2011). COM-B has three layers: 1) sources of behaviour (capability, opportunity, and motivation), which influence whether a behaviour is likely to happen; 2) intervention functions (e.g., education, persuasion, modelling, environmental restructuring); and 3) policy categories (e.g., regulation, guidelines, communication/marketing). The COM-B model is roughly equivalent at the level of ‘sources of behaviour’ (COM) to the means, motive, and opportunity (MMO) model used in policing and justice, and subsequently in other research and practice on change and development.
In this post, I illustrate the progressive build of an influence diagram for reporting behaviour based on practice and research, starting with capability, opportunity and motivation. This might be useful to professionals seeking to understand reporting behaviour in an organisation. The diagram is not ‘complete’ and the elements and resolution will differ for different purposes, contexts and situations.
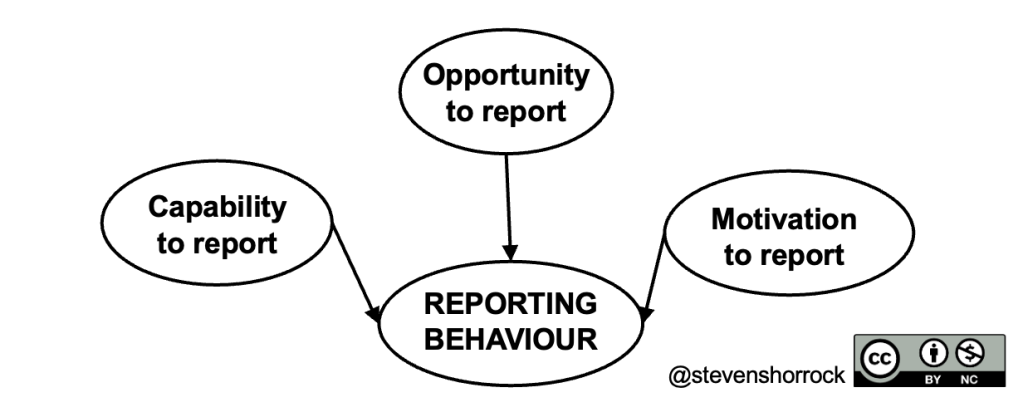
Capability to report
Capability refers to the psychological and physical ability to enact the behaviour of interest.
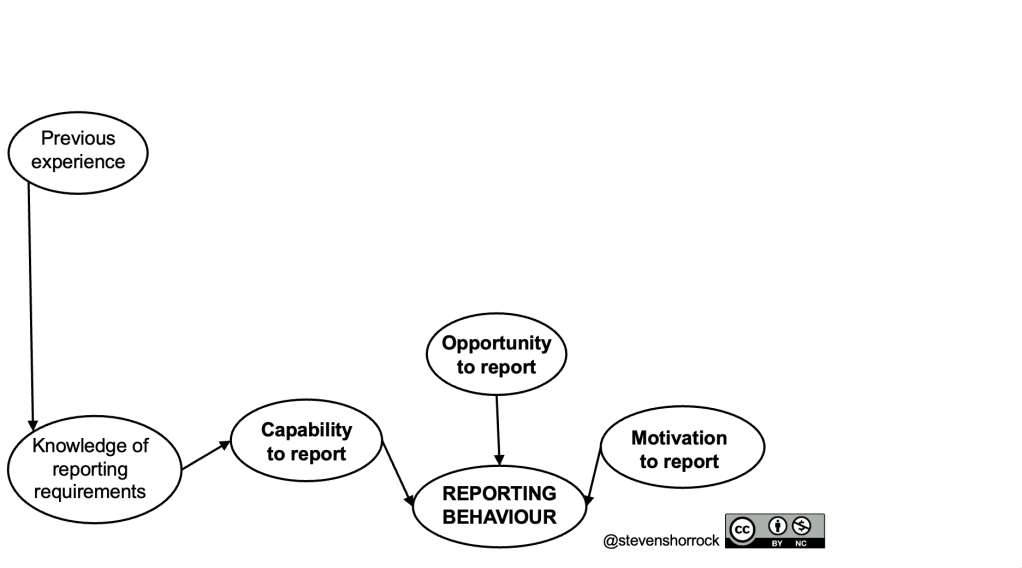
Knowledge of reporting requirements
For reporting behaviour, capability to report will be influenced by the knowledge of reporting requirements (who, why, what, when, where, how). This is a basic enabler of reporting. Capability to report in turn is influenced by previous experience including exposure to and experience of policy, procedure and guidance material (work-as-prescribed), instruction and training (work-as-instructed), observation of others’ reporting behaviour (work-as-observed), and one’s own previous direct experience of reporting (work-as-done). In the diagram below, these are grouped as ‘previous experience’ but they could be separate influences and this be more useful if discussion suggests these are the key influences of interest. Perhaps there is evidence that people don’t know how to report, or perhaps you need to check understanding of reporting requirements.
Opportunity to report
Opportunity refers to the physical and social environment that enables behaviour.
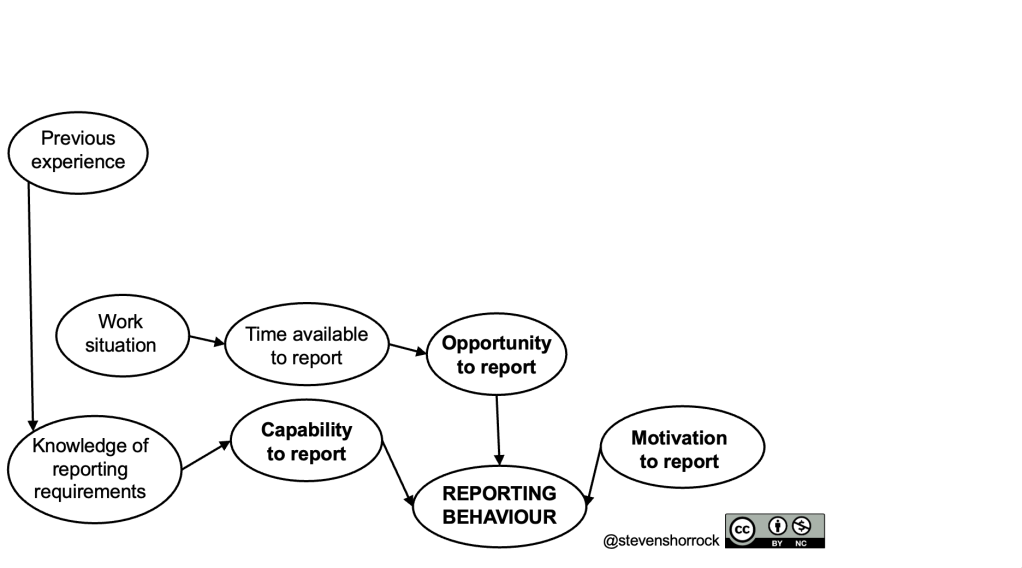
Time available to report
Fundamentally, people must have the time to report. This is problematic for many people, especially in time-pressed operational roles. The time available is therefore influenced by the work situation, including workload, staffing situation, time provided specifically for reporting, requirement to use rest breaks for reporting, and so on. Again this might be expanded with such influences if this is, or could be, a significant influence in practice, or if you want the influence diagram to be more explicit on these components.
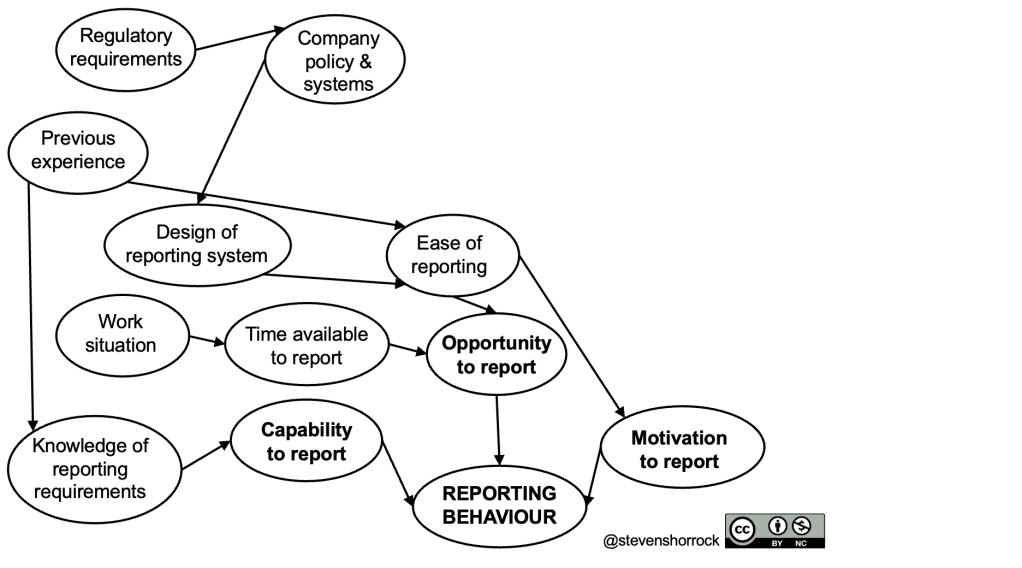
Ease of reporting
Ease of reporting also influences the opportunity to report. Assuming that a reporting system is available, the design of this system will influence how easy it is to use. This in turn is influenced by company policy and systems (for safety, quality, design, recruitment, and so on). (Design of the reporting system will of course have other influences which are not listed here, such as design expertise, and if this is the influence of interest, a more detailed influence diagram could be created for that or the influence diagram could be expanded.) Company policy and systems concerning reporting are influenced by, among other things, regulatory requirements. Ease of reporting is also influenced by previous experience with reporting systems; we may know how to use a system which is not easy to use, but practice can make use easier. Ease of reporting influences the next source of behaviour: motivation to report.
Motivation to report
Motivation is the third major influence on behaviour. Motivation involves “the reflective and automatic mechanisms that activate or inhibit behaviour”. For this influence diagram, it is the major source of behaviour of interest.
Perception of personal consequences
Aside from ease of reporting, motivation is influenced by perception of personal consequences. Significant perceived negative consequences are likely to influence a person’s motivation to report. This perception will be influenced by the nature of the incident; serious outcomes are more likely to be associated with more deleterious personal consequences, depending on the organisational context (e.g., just culture arrangements) and perhaps the judicial context. Detectability of the incident, is also likely to be relevant, as well as the potential for significant harm in future and the likelihood of recurrence. Perception of personal consequences will also be influenced by previous experience of reporting (direct and vicarious) and company policy and systems (e.g., Just Culture policy, reporting policy, HR policies). More influences on perception of personal consequences will be revealed later, which could influence perceptions and motivation negatively or positively.
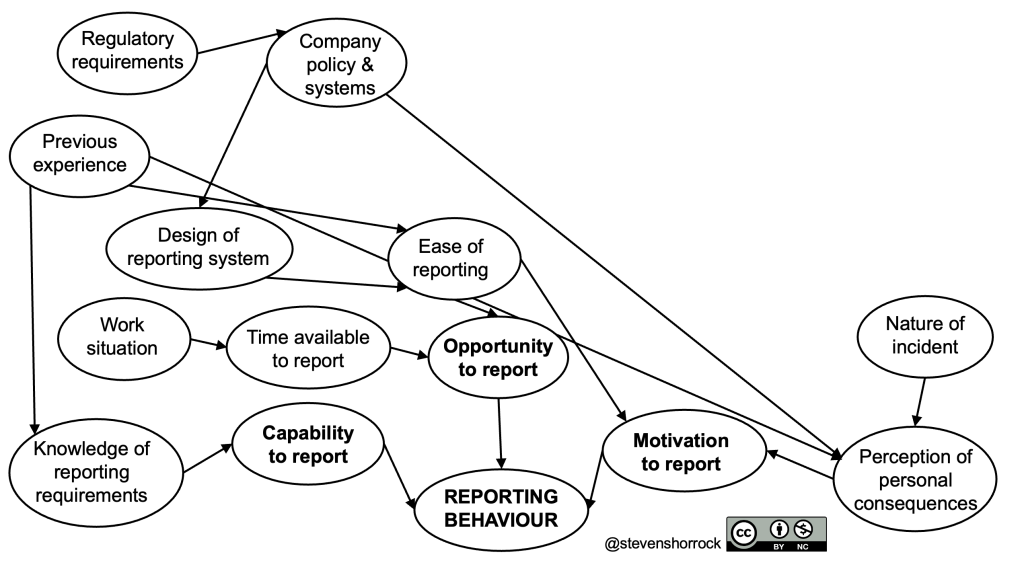
Perception of confidentiality
People at work can have concerns about confidentiality of reporting. The felt need for confidentiality is related in large part to fear and shame regarding the consequences of reporting (e.g., stigma and judgement of peers, the investigation process, official sanctions, effect on self esteem). Company policy on confidentiality and associated systems to maintain confidentiality will influence expectations regarding confidentiality. But these may not reflect reality. Experience may be a stronger influence; people tend to trust their past experience as predictive of the future. Direct or vicarious experience of breaches of confidentiality and associated unwanted consequences have a long-lasting effect on people’s perception of the confidentiality of a reporting system. The nature of an incident is also likely to influence the perception of confidentiality of a reporting system. Accidents with significant consequences may be well known inside and even outside of organisations, and involvement may be hard to ensure. In other cases, especially in small teams, it may be impossible to maintain confidentiality among peers; everybody knowns everything that happens. In some cases, especially in contexts where incidents are not associated with stigma or shame, people are unconcerned about their identity being known by others, such as peers. People involved in incidents are even sometimes involved in the telling of the story.
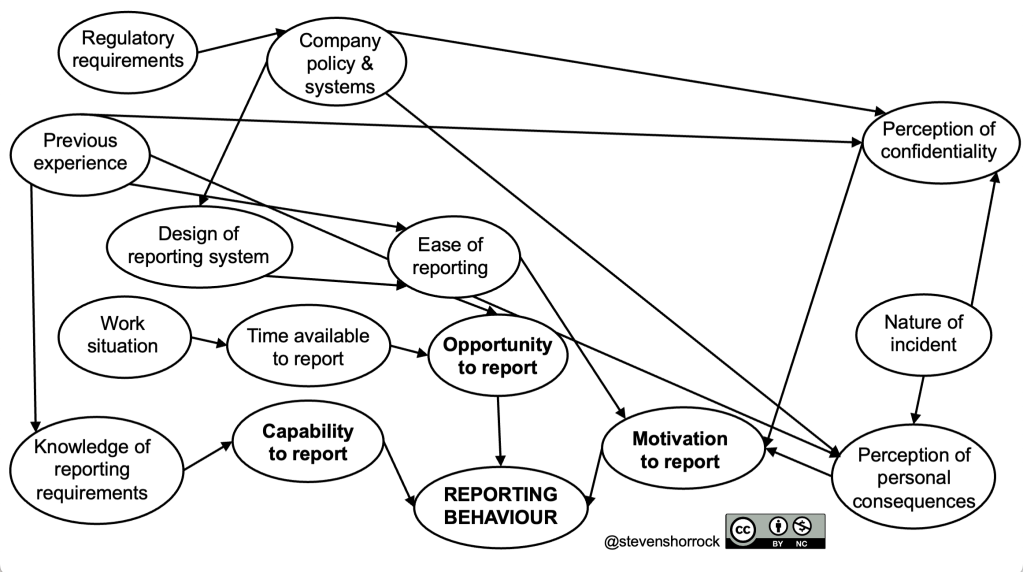
Expectation of feedback
Expectation of feedback can have a strong influence on motivation to report. People often want to be informed about the progression of any associated investigation or review, others’ contributions to incidents, contributory factors, recommendations, and associated learning and change activities. For instance, an air traffic controller may report an airspace infringement by an aircraft, and may wish to understand the circumstances of this. A nurse may report an incident concerning drug administration on a previous shift, and may wish to remain informed of how this occurred; perhaps there are systemic implications that could affect nursing practice. Similar to the perception of confidentiality, expectation of feedback is affected by company police and systems, and – more powerfully – previous direct and vicarious experience.

Company-level learning and change following reporting
The purpose of reporting concerns learning and change. This is especially true at a company level, since there may well be systemic learning opportunities that extend beyond the specific situation that was reported. This may be influenced by company policy and systems. There will be previous experience of this, which will be discussed among peers, and learning and change will influence expectation of feedback, since evidence of learning and change is a form of feedback. Company level learning and change will also influence perception of personal consequences. Systemic learning that does not involve blaming and stigmatising individuals for ‘honest mistakes‘ or ordinary human performance variability will tend to reduce fear of personal consequences. Change such as public shaming and official sanctions on individuals will tend to have the opposite effect, increasing fear of consequences among people, and reducing motivation to report or disclose certain incriminating details (defensive reporting).
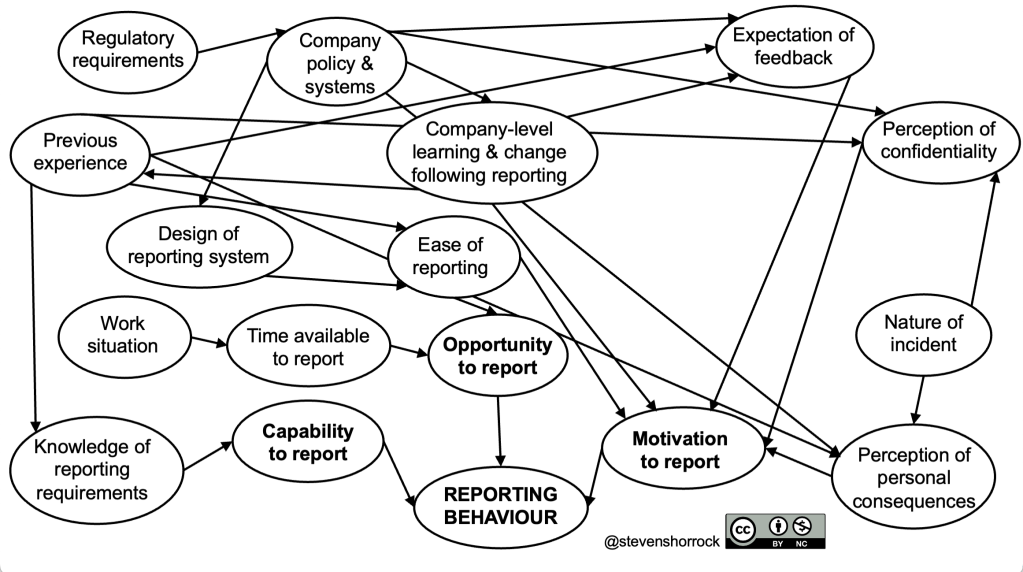
Peer group values, attitudes and practices
A person’s peer group can have a profound effect on motivation to report. Peer values, attitudes, and practices will tend to have patterns and commonalities which we might characterise as a local or team culture. Peers will have observed historical company-level learning and change following reporting, which will influence their attitudes and beliefs and associated practices. These values, attitudes and beliefs about reporting and associated issues such as personal consequences, confidentiality, feedback, and learning and change, will be modelled and communicated among peers, implicitly and explicitly. This may result in statements that reduce motivation to report (e.g., “Don’t bother reporting. We’ve reported it many times before and nothing changes.” “It’s no big deal. No need to report.” “You’ll get us in trouble if you report.”) Alternatively, such attitudes may be implicit in the context and behaviour.
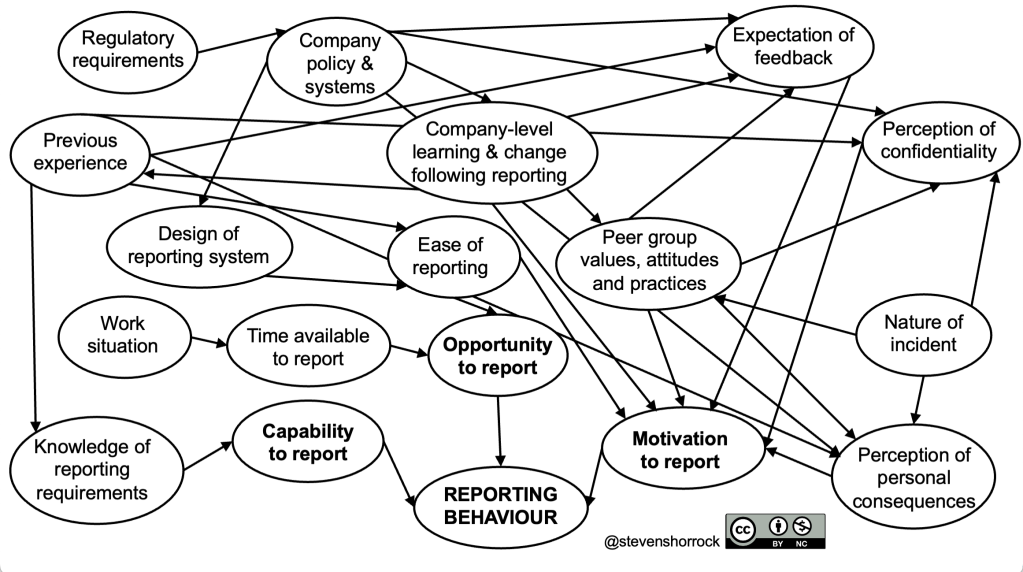
Management attitudes and behaviour
Finally in this influence diagram we come to management attitudes and behaviour concerning reportable incidents or occurrences. Some attitudes and behaviour will be judged positively by people, such as curiosity, humility, empathic understanding, care and concern for wellbeing, and genuine interest in learning and systemic improvement. These are more likely to increase motivation to report. Other attitudes and behaviour will be judged negatively, such as prejudgement, unofficial ‘side investigations’, scapegoating, and disregard for wellbeing. These are likely to decrease motivation to report. Management attitudes and behaviour will be influenced by the nature of the incident or event. For instance, accidents with more serious consequences are likely to be associated with very different attitudes and behaviours compared to minor occurrences, even given the same decision making and behaviour in the run up to the event.
Management attitudes and behaviour will be influenced by and will influence perceived staff values, attitudes, beliefs and practices, company policy and systems, and company-level learning and change following reporting. Management attitudes and behaviour will also influence people’s perceptions of the personal consequences and confidentiality of reporting. One bad reaction will likely have a disproportionate impact (a barrier to ‘Just Culture’).
This brings us to the final influence diagram.
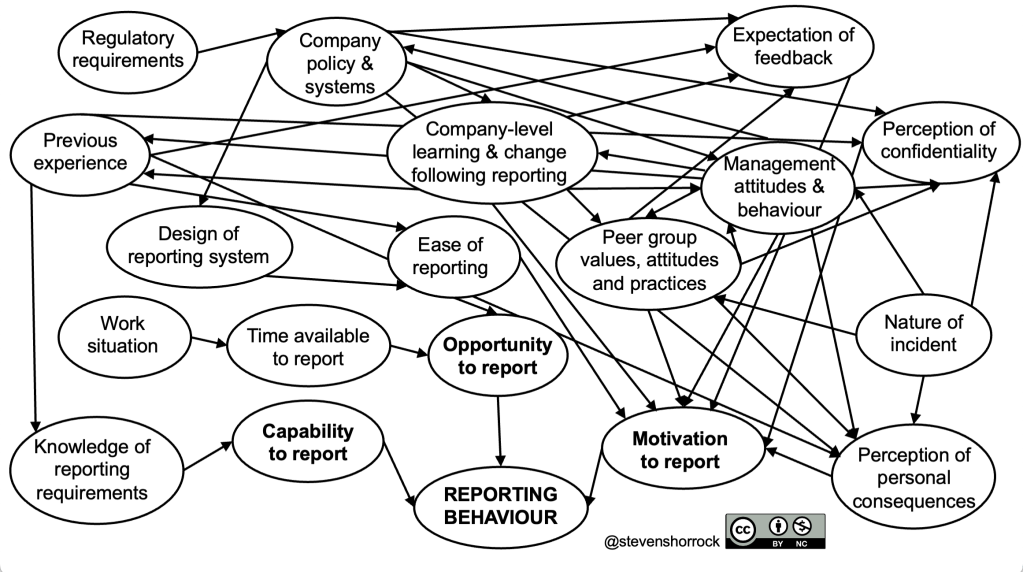
“Why Aren’t They Reporting Incidents?” Influences on Reporting Behaviour © 2023 by Steven Shorrock is licensed under CC BY-NC 4.0
Focusing on problematic influences
We now have a rather complicated influence diagram (which could be even more complicated with the addition of further components and arrows). This should not be off-putting. What is important is the quality of the reflection, discussion, and insights while developing the diagram, and while presenting it to others (usually best done bit-by-bit). But we are likely to wish to focus on what we believe from evidence are strongest or most systemic influences in the diagram, and among those perhaps the influences most amenable to change. In this case, we can delete the influences and associated arrows that are unconnected. This simplifies the diagram, making it easier to understand especially for those uninvolved in prior development..
There may be evidence from surveys, focus groups or informal feedback that management attitudes and behaviour are a very strong influence on reporting. Perhaps following an incident, a manager has the habit to go straight to the person involved to demand an explanation, short-circuiting official investigation processes and generating fear and resentment among staff. Management attitudes and behaviours are likely to be influenced strongly by the seriousness of the incident, and will have a strong influence on peer group values, attitudes and practices, and perception of personal consequences. There are other influences as shown below. Strong influences are depicted as bold arrows.
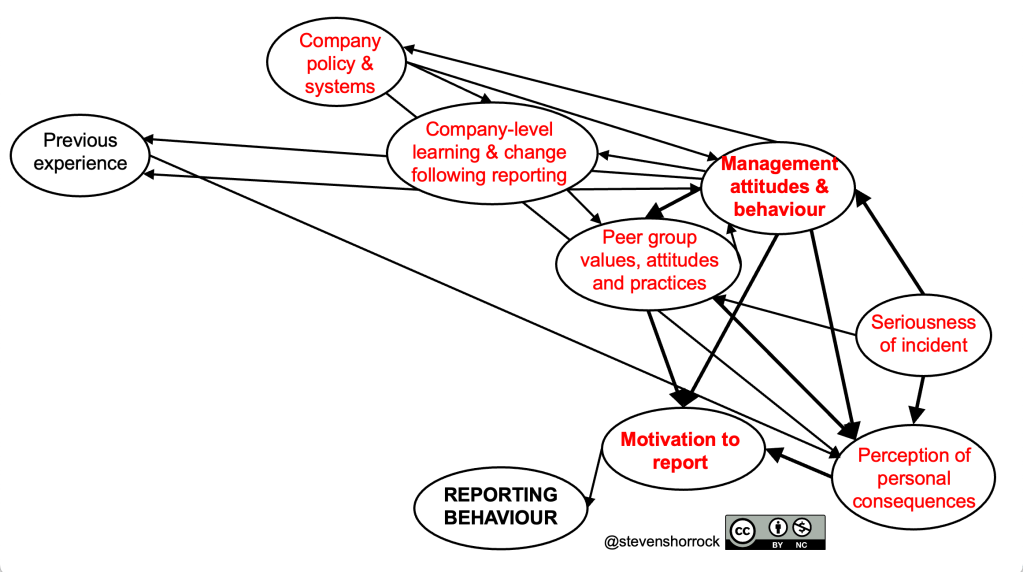
In this case, we may want to consider how we can influence these management attitudes and behaviours. Strong potential influences that are amenable to change may include company policy and systems, company level learning and change following reporting, and other managers’ attitudes and behaviours. But in some cases, an intervention is needed beyond these influences, perhaps in the form of education and coaching. This may concern, for instance, complexity, systems thinking, ethics, human performance, organisational behaviour, and leadership.

Here is is another example. In this case, a person has a low expectation of feedback following reporting. This is strongly influenced by their previous experience, their peer group, and their perception of company level learning and change following reporting.
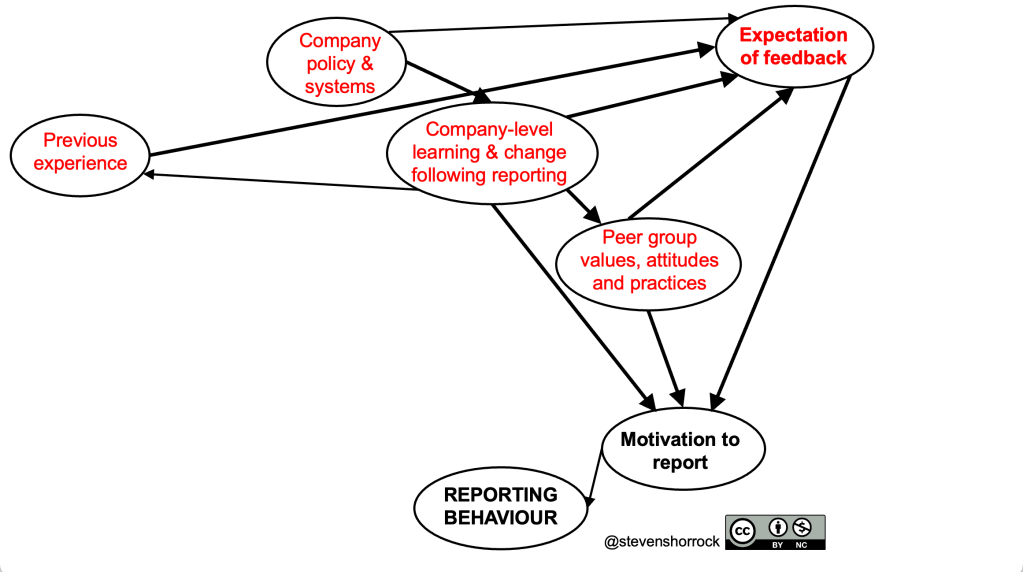
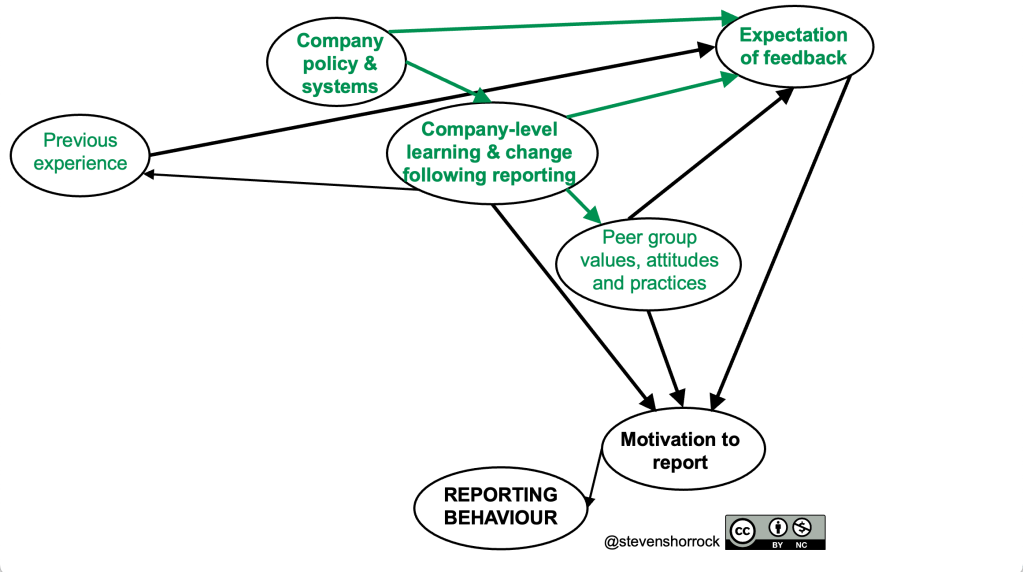
In this case, we might want to improve expectation of feedback by acting on two other influences. Company policy and systems could be improved, since they currently have a weak influence on expectation of feedback currently. Provisions could be made to specify and facilitate the nature and timing of feedback that reportees should receive. Company-level learning and change following reporting could also be communicated to staff, so that there is better awareness of learning and change in practice, which in itself is a form of feedback. Often, changes as a result of occurrences occur later and are not well communicated.
Notes on influence diagrams
The influence diagrams are not ‘complete’ depictions of the influence in the situation, but should be as complete as necessary for the purpose of the analysis. More influences on components could be depicted, but it should be ensured that these are influences on the components, not descriptions of aspects of the components. Influence diagrams are normally drawn without predefined structure or levels (e.g., as can be found in AcciMaps, in a causal sense), such as society, industry, organisation, team, and individual. As depicted above, the thickness of the arrows is often used to indicate the degree of influence. Arrows may also be labelled to specify the type or nature of influence, and a key could added (e.g., in case colour coding is used or different line types). Bi-directional arrows are avoided unless each node has the same kind of influence. Distance between influences is sometimes depicted, though this has not been done above. Different software packages can be used, but sticky-notes often remain the most useful development method for in situ groups.
Concluding thoughts
The influence diagram on reporting behaviour using the COM-B sources of behaviour as a starting point helps to highlight the multiple influences on reporting behaviour, the strength of these influences and the possible points of intervention. It therefore helps to understand the current situation, get new perspectives and reveal blindspots, determine points of leverage for intervention, and explore options for intervention. It is then possible to explore the likelihood of success of the options for intervention and the level of commitment to these. This helps to reveal the complexity of the situation and possibilities for improvement instead of relying on unhelpful simplifications and stereotypes concerning reporting, and avoid associated reactions, which may worsen the current situation.
References
The following form part of the basis for the influence diagram.
EUROCONTROL. (2020). Safety Culture Discussion Cards. Edition 2 (multiple languages). Brussels: EUROCONTROL Network Manager. [webpage] (Designer, Developer)
Kirwan, B. and Shorrock, S.T. (2014). A view from elsewhere: safety culture in European air traffic management. In P. Waterson (Ed.), Patient Safety Culture: Theory, Methods and Application. Ashgate.
Noort, M.C., Reader, T.W., Shorrock, S.T. and Kirwan, B. (2016). The relationship between national culture and safety culture: implications for international safety culture assessments. Journal of Occupational and Organizational Psychology. DOI: 10.1111/joop.12139. [pdf]
Reader, T.W., Noort, M.C., Shorrock, S.T. and Kirwan, B. (2015) Safety san frontières: an international safety culture model. Risk Analysis: An International Journal, 35 (5), 770-789. ISSN 1539-6924. [pdf]
Shorrock, S. (2023, September). Why is it just so difficult? Barriers to just culture in the real world. HindSight, 35, Just Culture…Revisited. Brussels: EUROCONTROL. [pdf]
Tear, M. J. and Reader, T. W. and Shorrock, S. and Kirwan, B. (2018) Safety culture and power: interactions between perceptions of safety culture, organisational hierarchy, and national culture. Safety Science, 10.1016/j.ssci.2018.10.014
More information on research, see references concerning safety culture, just culture and safety reporting at https://humanisticsystems.com/publications/.
Related Posts
https://humanisticsystems.com/tag/ep8/
https://humanisticsystems.com/tag/just-culture/
How to cite (APA)
Shorrock, S. (2023, November 17). “Why aren’t they reporting incidents?” Influences on reporting behaviour. Humanistic Systems. humanisticsystems.com/2023/11/14/why-arent-they-reporting-incidents-influences-on-reporting-behaviour/
Creative Commons Licence
“Why Aren’t They Reporting Incidents?” Influences on Reporting Behaviour © 2023 by Steven Shorrock is licensed under CC BY-NC 4.0
This license requires that reusers give credit to the creator. It allows reusers to distribute, remix, adapt, and build upon the material in any medium or format, for noncommercial purposes only.